

In a previous post, we scraped NBA matchup data for the 1996-97 through 2016-17 seasons. We also noted that, during that time period, on average the home team won roughly 60% of home games during the regular season.
This is a big deal. An average team should win 50% of the time on a neutral court, but history shows that home court is worth a roughly 10% boost in win probability during the regular season. We’ll focus on the playoffs in a later post. Home court clearly matters a lot in the NBA post-season as well.
In this post, we’ll start by reviewing some of the main explanations for home court advantage in the NBA. Then, we’ll take a quick look at how the advantage has varied since the 1996-97 season. We’ll also look at how the advantage shows up in point differentials.
This post is the first of several short posts I plan to write about NBA home court advantage in the coming weeks. Ultimately, we are going to look how to predict basketball matchups for the back half of the current season. In order to do that, we need to first examine the historical data and come up with a reasonable model. Home court advantage is one of the most obvious things that jump out from the data. So we need to take some time to explore it a bit.
Why Does Home Court Advantage Exist?
A lot has been written about home court/home field advantage in general. The NBA in particular exhibits a relatively large regular season and playoff home court advantage compared to some other sports.
It’s interesting that basketball should have a relatively large home advantage compared to other sports. In major league baseball, stadium dimensions can vary significantly, and the home team always has last licks. In contrast, every court in the NBA has exactly the same dimensions. Yet, statistically, home court matters a lot more in the NBA than home field does in MLB.
People have advanced a number of theories over the years about why home court advantage exists:
- Crowd noise or stadium music distracts visiting players
- Fan support gives a psychological boost to home players
- Subtle arena differences are unfamiliar or distracting to visiting players
- Home players are more used to stadium altitude, temperature or humidity
- Visiting players are more fatigued after travel
- Referees make biased to please the home crowd
How true are these theories?
According to academic research published in an influential book, most of these theories are false, with the exception of travel fatigue and referee bias. You can read a summary of the research in this article.
For now, we are going to focus purely on examining the data, rather than trying to answer the question of which theory makes the most sense. Later on, we’ll look at travel distance and rest and try to incorporate them into our predictions.
Has Home Court Advantage Declined Recently?
In a widely-read 2015 article on ESPN, Tom Haberstroh made the argument that home court advantage in the NBA was in the midst of a major decline. He pointed out that NBA home court advantage averaged in the high-60% range in the 1970s, and had plummeted to around 53% in the 2014-15 season when we wrote the article. He argued that there were three potential reasons why NBA home court advantage had declined permanently:
- The increased usage of the 3-point shot has made the game less dependent on referees. With more outside shooting, fewer shooting fouls get called.
- Teams are getting better at using technology and advanced medical training to help deal with travel fatigue.
- Fans are less involved in the games because they are spending more time looking at their phones. Also, HD televisions at home and an increase in corporate boxes at stadiums has shifted the attendance away from committed fans and more toward casual attendees. Haberstroh argued that this shift makes the crowd less of a psychological factor.
Unfortunately for Haberstroh, by the end of the 2014-15 season, home court advantage had come roaring back to its usual historical importance, as described in this excellent Economist article. The main take-away from the article is: look at the historical variation in data, and have a view about what reasonable variation is, before imagining that you see a trend. We all love to see patterns where none may actually exist.
Interestingly, Haberstroh returned to this topic of home court advantage in an article last year. In this article, he argued that visiting teams are getting more sleep, because they are partying less. His explanation: Tinder. I’ll leave it to you to draw your own conclusions.
Let’s look at the data.
How Has Home Court Advantage Varied Since 1996?
Please see this Jupyter notebook for the code used to produce the data, analysis and figures in this post.
The data consist of 24,797 regular season matchups from the 1996-97 through the 2016-17 NBA seasons. That’s 21 complete seasons.
These matchups were scraped from stats.nba.com in our earlier post.
Over those 24,797 games, the home team won 59.8% of the time. However, it’s more useful to look at the home team average by season. That way, we can see how home court advantage has varied over time.
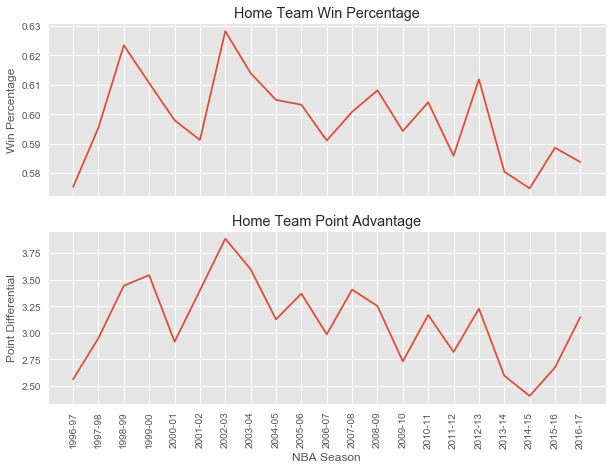
As you can see, there is meaningful variation season-by-season. There may seem to be a hint of a downward trend in the home court win percentage. This may be part of what Haberstroh saw in his analysis. However, the win percentage is still well within the normal range of variation over this historical period.
The other way to look at home court advantage is point differential. After all, to win basketball games, you have to score more than the other time. Therefore, home court advantage should show up in point differentials as well.
It turns out that the home team has outscored the visiting team by 3.11 points on average, during these 21 seasons. The lower panel of the figure shows how this point differential has varied, season-by-season. Looked at in terms of point differential, home court advantage certainly doesn’t seem to be trending lower.
There almost certainly has been a significant reduction in home court advantage since the 1970s. The game has changed a lot since then. But, at least over the last 10 years, the data do not support the claim that home court advantage matters less in the NBA.
A Closer Look at Point Differentials
Averages can be misleading. Although the assumption of a 3-point home team advantage is common among sports analysts, there is a lot of variation going on under the hood. Let’s plot the point differential (home team minus away team) for all matchups for the 2016-17 season. For reference, the point differential averaged 3.15 over that season, similar to the 21-season average.
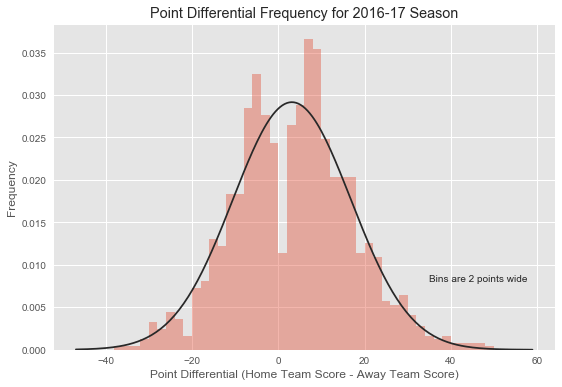
The curve overlaid on the plot is the bell-shaped normal distribution that has the same mean and standard deviation as the point differential data.
The fitted curve does a reasonable job of fitting the data away from the center of the distribution, but it does a poor job for the center. Since basketball games can’t end in ties, zero is not an allowed point differential. Also, we see that only a little more than 1% of games end within a 2 point margin of victory. So, the normal distribution is too high for small margins of victory, and too low for typical margins of victory.
This suggests that will need to be very careful about how we choose to model and predict NBA point differentials.
To make sure this effect isn’t just a coincidence for the 2016-17 season, let’s generate the same plot for the entire data set.
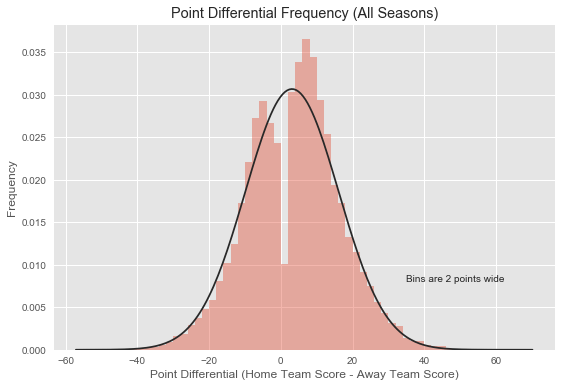
We get the same basic message looking at all 21 seasons. The data look very “normal” away from the center, but aren’t in the middle of the distribution. The normal distribution should give you a reasonable approximation for the probability of big blowouts, but doesn’t do an adequate job for typical games.
Conclusion
This is only the start of our analysis of NBA home court advantage. Hopefully, this post has whet your appetite to think more about why this advantage exists, and how to model it. Also, we saw the importance of putting variation in historical context, to make sure we don’t imagine trends when what’s really happening is only typical variation in the data.