
This is our fourth post about home court advantage in the NBA. If the home team has a higher win probability, that advantage should be evident in at least some of the box score statistics. Home court advantage could result from better offense, better defense, or a mix of the two.
In this post, we’ll examine how basic box score statistics vary between home and away games.
We’ll continue to use the 24,797 games from the 1996-97 through 2016-17 NBA regular seasons as our data set.
Please see this Jupyter notebook for the code used to produce the data, analysis and figures in this post.
Aggregating the Data
We are going to try to identify which team box score statistics improve at home compared to on the road. In order to do this properly, we need to isolate the impact of location (home versus away) from the match up itself. Otherwise, the variation created by differences in opponent quality will swamp the impact of home court.
To do this, we are going to group box score statistics by season, team, and opponent. Grouping in this way will allow us to control for the variation in team quality in different seasons. It will also allow us to control for the different quanlity of various opponents.
Within this grouping, we will separate the home games from the away games, and get the average box score statistics for each. Then, we can subtract the average away game statistics from the average home game statistics. The difference between the grouped home and away statistics will be our measure of how team performance improves just by virtue of playing at home.
The Python code in the Juypter notebook uses pandas to implement this idea. It also scales the statistics for a standard 48-minute game and computes shooting percentages for field goals, three-pointers, and free throws.
This post will only show the main results of the analysis. See the Jupyter notebook if you want to get the details on how the data were sliced and diced to produce these results. The notebook is also a good example of some of the more advanced pandas techniques you can use to organize and analyze data. In particular, you might want to check out how the NBA lockouts from the 1998-99 and 2011-12 seasons made an appearance in the data preparation.
Home Court Impact on Box Score Statistics
Let’s get right to the results. What is the impact of home court on box score statistics?
Scoring
If you look at the pts column, you will see that the same 3.1 point home court advantage emerges from our aggregated data.
Looking at that same column, you will also see that there is a lot of variation around that average. Remember, the data we’re looking at are match ups within a particular season. The point differentials between the same two teams is not very consistent, even within the same season.
Let’s plot the point differential.
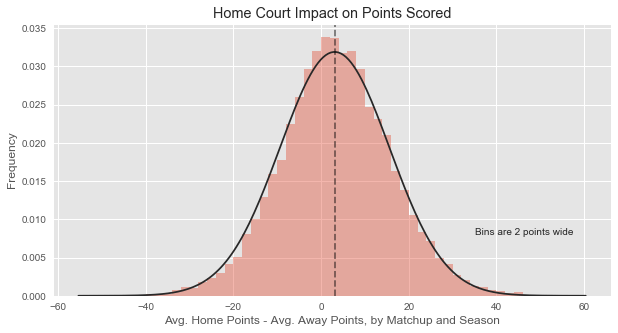
The plot shows that a normal distribution fits the aggregated data relatively well. Nothing really stands out from the plot. Even so, the average impact of 3.1 points looks relatively small compared to the noisiness of the data.
Better Shooting Isn’t the Whole Story
It’s hard to pinpoint exactly how home court advantage translates into superior scoring. Field goal percentage goes up by about 1.2% on average, and three-point shooting percentage goes up by about 0.9% on average.
These modest improvements in scoring percentage are pointing in the right direction, but aren’t sufficient to clearly explain the magnitude of NBA home court advantage.
Other Statistics
If you look at the other statistics, you will see that rebounding improves, and assists improve, and turnovers improve, and steals improve, and blocks improve, and personal fouls called against the team improve. Of course, you wouldn’t expect statistics like blocks and personal fouls to directly benefit scoring.
The overall message is: teams really do play better at home, and the benefit shows up in a lot of statistics. We will have to dig deeper in future analysis to try to understand better what is going on.
Box Score Variation by Team
To conclude, let’s look at how these same statistics vary by team, aggregated over the course of the 21 complete regular seasons.
In this table, we are sorting by average point differential (home versus away), grouped by season and matchup. In this ordering, Denver is still on top, but teams such as Utah and Cleveland are further down the list than in our prior analysis.
This table also makes clear that the impact of home court on particular statistics appears to vary significantly by team. For example, the Nuggets, the Jazz and the Pacers show a relatively large drop in turnovers, while the Warriors and the Spurs show a relatively large increase in shooting efficiency.