

In this post, we will learn about the Elo rating system. This system was originally developed to rate chess players, and has become a very popular tool to analyze many sports. We will look at how to apply the system to basketball to rate NBA teams. My goal is to show you the key assumptions and math behind Elo ratings, and how to implement the system in Python. We will use Elo ratings in upcoming posts to examine NBA playoff match ups.
My other goal is to point out some of the limitations of Elo ratings. In future posts, we will examine ways to address these limitations, and look at alternative ratings systems that try to do a better job.
We will keep things relatively simple for this introductory post. Our Elo ratings will incorporate an adjustment for home court advantage, but will omit a lot of features that need to be implemented in a full-fledged system. Home court matters a lot in the NBA, as examined in this earlier post. Any reasonable NBA rating system has to take account of this fact.
There are two main ways Elo systems are used in sports analysis. The first just looks at wins and losses (and, in sports such as soccer, ties). This is how the Elo system was originally constructed, since chess has wins, losses and ties, but no concept of score. Other Elo systems try to incorporate margin of victory, under the theory that team strength should be related to margin of victory. This introduces a lot of complications to a ratings system. For this introductory post, we are going to only use wins and losses to estimate our ratings.
The other big decision to make in rating teams is how to handle changes across seasons, as rosters and coaching change. Most Elo systems try to chain together data across seasons, and make various adjustments to try to adjust for team changes. To keep things simple in this post, we are going only look at ratings within a season.
In upcoming posts, we will look at various ways to extend our simple ratings to address these and other issues, and also at how to evaluate which models produce better predictions in practice.
This post is going to have some math in it. That’s unavoidable if you really want to understand how a ratings system works, as well as its strengths and weaknesses. This is also a long post, since I want to lay out all of the main ideas about Elo ratings in one place. The good news is that the math for the Elo system is relatively straightforward. The Elo system is also a great starting point to learn about sports ratings in general. As we look at other ratings systems in future posts, we will be able to build on some of the ideas in this post.
Why are Elo Ratings So Popular?
The Elo system was originally developed by physicist Arpad Elo in 1959 to rate chess players. Worldwide chess organizations gradually adopted Elo’s system over the 1960s and 70s. Although developed for chess, Elo ratings can be used to rate participants in any sort of competition having many competitors, having matches over an extended time period, and where each match is head-to-head between two competitors. The competitors can either be individual players (as in chess), or teams.
The sports analysts at FiveThirtyEight have been using versions of Elo ratings for various sports for a number of years, including the NFL, college football, the NBA, college basketball, Champions League soccer, the World Cup, Major League Baseball and tennis. If you search the web, you can find many variants of Elo ratings for many sports, including some unusual ones such WWE wrestling and NASCAR. The NASCAR example is interesting, since car racing isn’t a head-to-head sport and therefore requires significant modifications to the traditional Elo system.
Ratings Adjust Over Time
Elo ratings adjust over time to competitor performance, increasing when players/teams win, and decreasing when they lose. Furthermore, the system automatically adjusts ratings more for surprising outcomes: an upset of a strong team by a weak team moves the relative ratings more than the outcome of a 50-50 game between truly equal competitors. The outcome of an even match up could be purely due to chance, and so might not convey as much information about team quality as a major upset.
Incorporate Strength of Schedule
Elo ratings also naturally incorporate the competitors’ strength of schedule. A team that beats strong teams should end up with a higher rating than a team that has only played weak teams. We will examine this more fully in a future post.
Easily Estimate Win Probabilities
Another important feature of Elo’s system is that it gives you a way to quickly estimate win probabilities in a match up, even if two competitors have never met before. We will look a lot more closely at win probabilities later in this post.
The above considerations explain why Elo ratings are so popular. The question is, do Elo ratings do a good job of predicting future matches? In order to answer that question, we’ll need to look at data. First, let’s try to understand the basic ideas behind the system and build our own simple version.
Elo Ratings for NBA Teams Over the 2017-18 Regular Season
To keep things interesting, I’m going to show you the results of the simple Elo ratings before we dive into the details. Here is a chart of Elo ratings over the 2017-18 regular season for the six teams that won their respective divisions. The dominance of Houston and the impact of Curry’s absence from the Warriors jump out from this chart.

Again, these ratings were computed using the simple assumptions in this post. In future posts, we’ll explore ways to design more realistic and complicated ratings.
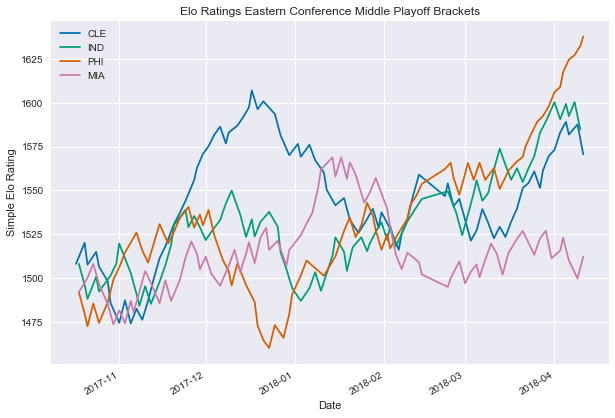
Let’s look at a few of the more interesting playoff match ups. Here’s a chart of the middle brackets in the East, with the 76ers versus the Heat and the Cavaliers versus the Pacers. You can see the phenomenal run Philadelphia has had reflected in its ratings. The Cleveland/Indiana match up appears much more balanced using these simple Elo ratings.
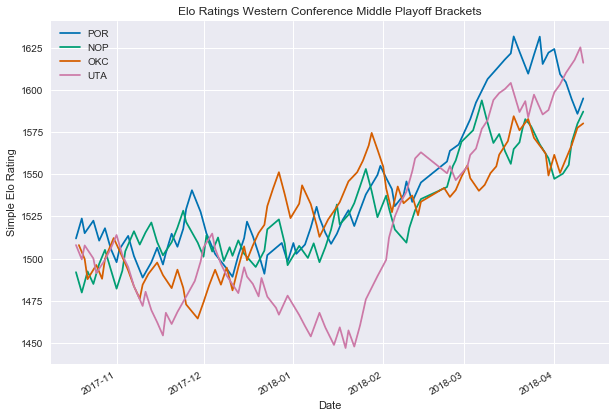
Here is a similar chart for the Western Conference middle brackets. In addition to having generally higher ratings than the comparably seeded Eastern teams, these match ups all look to be very interesting if these simple Elo ratings are any guide.
The Basic Idea, and Some Math
Let’s dive into the assumptions and math behind Elo ratings. We will look at these in the context of the NBA, to make the ideas and symbols more concrete and, hopefully, easier to understand. However, the same ideas will apply to college basketball and many other individual or team sports.
What Do Ratings Mean?
A rating is a number that represents the “strength” or “quality” of a team. The team with the higher number is the “better” team, and has the higher probability of winning the game. All of the player and coaching talent, play execution and hustle are represented by this single number. As I mentioned above, for now we will ignore roster changes or injuries.
In this simple model of a basketball match up, the only other important factor is which team has home court advantage. In more advanced models, we could include potentially important and complicated factors that depend on the context of the game in the overall season. For example, is the game a must-win for one of the teams to secure a playoff spot? Is the team out of playoff contention, and “tanking” to get a better position in the draft? For now, we will keep things simple and assume each team is consistently trying to win every game.
Distribution of Team Performance
Even if each team is trying its hardest, in any given game, teams play better or worse than their typical quality. Lower-quality teams sometimes beat great teams. Maybe the great team had the occasional rough day, or the worse team played inspired basketball and rose to the occasion. The rating system represents this idea by assuming that the team performance has a probability distribution around its typical quality (as represented by the rating).
How does team performance vary around its typical value? There are many probability distributions you could pick to represent the variation in team performance. This is a relatively complicated topic, so it’s better to cover it more fully in an upcoming post. The good news is that the choice of distribution made for the Elo system makes computations relatively easy.
Also, the Elo system enforces a simple and understandable transitive property for the odds of winning between any two pairs of teams.
A Quick Overview of Odds
In case you’re not familiar with odds or need a refresher, here’s a quick overview. If the probability of some event happening is p, then the odds on (or odds in favor of) that event happening are:
If an event is impossible, the odds on it happening will be zero. If the event is very likely, then the odds on it happening will be very high (and infinite if 
If we know the odds in favor of some event, we can use the above definition to solve for the probability in terms of the odds:

Sometimes, odds are expressed as odds against an event happening. Odds against an event are just the reciprocal of the odds for an event. Odds against are particularly convenient if the event is considered very unlikely. If an event is very unlikely, the odds against it will be high. If the event is certain to happen, the odds against it will be zero.
For example, prior to the recent NCAA Tournament, Las Vegas betting odds that UMBC would win the championship were 3000:1 (read “3000 to 1”) against. This is a little easier to say and understand than 1:3000 odds on. Expressed either way, the probability implied by these odds that UMBC would go all the way was 
Transitive Property of Elo Odds
Say we have three teams, Atlanta, Boston and Charlotte, represented as teams A, B and C. Suppose that A has a 75% probability of beating B. An equivalent way to say this is that the odds on A winning are 3:1. Suppose also that B has an 80% chance of beating team C, equivalent to 4:1 odds on B winning. Then, if A is going to play C, what are the odds on A winning?
We will examine the details of the Elo probability distribution assumption in the upcoming post, but the simple answer to this question is that the Elo system choose a probability distribution so A has 12:1 odds on beating C. You just multiply the odds on A against B and the odds on B against C. In this case, the 12:1 odds are equivalent to saying that A has a 
Ratings and Win Probabilities
Now we are ready to get to some of the math behind the Elo rating system.
Ratings Scale
As I mentioned above, ratings are just a number representing teams’ typical quality. In any numerical system, the scale is somewhat arbitrary. We could say the average team has a rating of 100, or zero, or even -100. Historically, many Elo-type ratings systems have used a value of 1500 for the average competitor. We are going to use the same value for our system, because it will make it easier to compare the results of our ratings to FiveThirtyEight or other systems.
Because of the arbitrary nature of the ratings scale, you can’t compare ratings between dissimilar groups of players or teams. If an NBA team has an Elo rating of 1500 and an NCAA team has an Elo rating of 1900, you can’t say that the college team is favored to beat the pro team! The 1500 rating for the pro team just means it is average for the NBA, while the 1900 rated college team is relatively strong for its peer group.
The analysts at FiveThirtyEight have used Elo ratings to try to compare teams across eras. This is a valid idea but very tricky. How would the 1990s Chicago Bulls with MJ match up against today’s teams? It’s a very interesting question, but for now, we are going to focus only on using ratings to compare current teams.
Win Probabilities and Home Court Advantage
We want to estimate win probabilities in a particular match up between a home team and a road team. The Elo ratings of the home team and road team are H and R, respectively. Assume for a moment that there is no such thing as home court advantage. Then, if H = R, the game should be a 50-50 toss-up. If H > R, the win probability will be greater than 
The Elo rating system assumes that the win probability is a function of the difference between the ratings, H – R, and perhaps some other factors like home court advantage that have nothing to do with team quality. Let’s incorporate home court advantage, by including a constant adjustment. We’ll call it A, for advantage. The adjusted Elo win probability will now be a function of H – R + A. The constant A is essentially added to the home team Elo rating. This is the same as saying that at home, teams play as though they are higher quality.
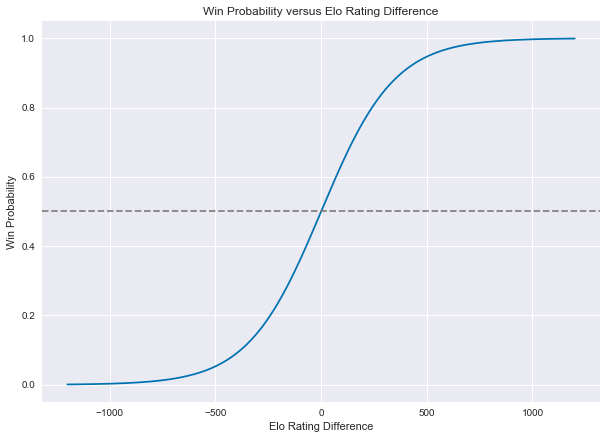
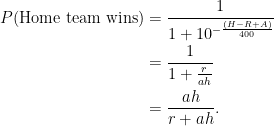
The formula for the home team win probability in the Elo system is:

This formula is an example of the logistic function. Here is a plot of the Elo win probability formula, without any adjustment for home court advantage:
Later on, we will look at how to determine the constant A, and how including it shifts this curve.
There’s a lot going on in the win probability formula, so let’s unpack it a bit. Focus first on the exponential expression in the denominator. What happens if H – R + A is zero? In that case, the home team win probability simplifies to:

Home Team Better than Road Team
Suppose that the home team, adjusted for home court advantage, has a higher rating than the road team. That is, R < H + A. Let’s call 

If x becomes very large, the denominator will decrease toward the value 1, and the home team win probability will increase toward 1. In other words, the home team is almost certain to win if its rating is much higher than the road team’s.
Road Team Better than Home Team
On the other hand, if x is negative, then 

Hopefully this gives you some intuition for why the graph of the logistic function above looks the way it does.
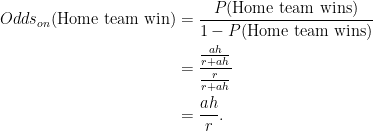
Elo Ratings in Terms of Odds
It’s easier to understand the Elo probability formula if we rewrite it in terms of odds.
Let’s define some new numbers based upon H, R and A as follows:

Using the product rule of exponents, we can rewrite the Elo probability formula as:
We haven’t yet talked about the formula for the probability that the road team wins, but it’s easy to figure it out. Since there are no ties in basketball:

Using these formulas, we can write the odds on the home team or away team winning as follows:

Some Observations
Similar to the choice of 1500 as the “average” Elo rating, the values 10 and 400 in the win probability formula are completely arbitrary. The numbers just mean that a 400 point shift in the ratings differential results in a factor of 10 change in the odds. You can see this most easily by looking at the Elo odds formulas we just derived.
As an example, suppose that H – R + A = 0, so that the odds on a home team win are 1:1. If H – R + A were 400 instead, then the win probability would be 
Suppose that you wanted to invent your own scale for Elo ratings, using a 1 to 10 type scale with 5 representing a league-average team. You could define the home team win probability formula as:

In this setup, a two-point ratings differential would equate to a 
Also, keep in mind that there’s nothing constraining these custom Elo ratings to the desired 1 to 10 scale. Ratings could exceed 10 and go below 1, even if it might be very unlikely to actually happen in practice. After all, a team with a rating of 0 would have a 
It’s important to understand that there is nothing that says win probabilities in basketball (or chess, or any other competition) have to follow the Elo formulas. The Elo system is a model for win probabilities that happens to be relatively simple to understand and easy to calibrate from match results. The above math doesn’t prove anything about the ability of the ratings to actually predict real-life match ups in basketball or any other sport. To do that, we’ll need to compare the Elo predictions with data.
Computing the Home Court Adjustment
Now we can look at calibrating our simple Elo to real NBA game data. First, let’s consider how to set the home court advantage parameter A (or equivalently, the related parameter a).
As we discovered in our previous analysis of home court advantage, since the 1996 NBA season, the home team has a win percentage of roughly 59.8%. Since this is an average across all the teams, it means that the “average” team has achieved this win percentage at home.
We want our win probability formula to produce a win probability of 50% for equally-rated teams, adjusted for the observed 59.8% home court win probability. This means that:
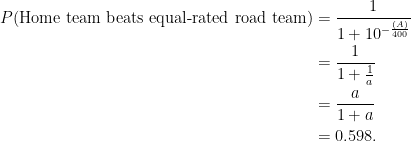
Solving, a = 1.487562. To find A, take the common logarithm (base 10):

In other words, the home court adjustment is worth almost approximately 69 Elo rating points in our simple system.
Here is a plot of the logistic function again, this time showing the original function (before adjustment for home court advantage) and the adjusted win probability function. Notice how the inclusion of the home court adjustment shifts the logistic function to align the zero rating differential with the 59.8% long-term home court win percentage. Equivalently, notice that the adjusted logistic function has a 50% home team win probability for a ratings differential of 69 Elo points in favor of the road team.

By the way, there’s no reason that the home court adjustment has to be the same for the entire league. If you have a strong opinion that home court advantage varies by team, you can have different adjustments for each team, and the Elo system still works. Our previous analysis showed that there is only weak evidence that NBA teams have persistently different home court advantages over time. Therefore, we will only use a single league-wide adjustment for home court in our Elo ratings.
Computing Elo Ratings
Now we’re almost at the end of the mathematical part of this post.
In our simple Elo system, we are going to ignore previous season records, and start each team fresh at the beginning of the season. We will set all team Elo rankings to the average value of 1500 prior to the first game of the regular season.
This is a very drastic assumption, since it ignores all the previous information we have about team quality and player talent from the previous season. Still, it makes this introductory post must simpler. Since we are now at the end of the regular season, we can benefit from all 82 games each team has played, and see how the ratings predict the post-season series. In an upcoming post, we will examine ways to incorporate team results across multiple seasons.
Teams increase their Elo ratings by winning games. Any win will increase its rating, and any loss will decrease its rating. The question is, how much should ratings change after a win or loss?
Expected Performance
The Elo approach is very straightforward. The idea is to compare game outcomes to the expected outcome. The rating change is proportional to how much a team under- or over-performs the expected outcome.
There are no ties in basketball, so the only two possible outcomes of a game are a win or a loss. To measure a team’s expected performance, we will define a win as worth one point, and a loss as worth zero points. Then, the expected outcome is just the win probability. For example, if a team has a 70% win probability in a particular match up, the team is expected to earn 0.7 points from the game.
To continue with this example, if the team actually does win, it has outperformed the expected outcome by 

Ratings Updates
The Elo update formula implementing these ideas is very simple.

In the above formulas, 


The variables 


For either team, the expression 
If you use these equations for
![\begin{aligned} R_{new} - R_{prior} & = K \times (W_R - p_R) \\ & = K \times [(1-W_H) - (1-p_R)] \\ & = K \times -(W_H - p_H) \\ & = -[H_{new} - H_{prior}]. \end{aligned}](https://s0.wp.com/latex.php?latex=%5Cbegin%7Baligned%7D++R_%7Bnew%7D+-+R_%7Bprior%7D+%26+%3D+K+%5Ctimes+%28W_R+-+p_R%29+%5C%5C+%26+%3D+K+%5Ctimes+%5B%281-W_H%29+-+%281-p_R%29%5D+%5C%5C+%26+%3D+K+%5Ctimes+-%28W_H+-+p_H%29+%5C%5C+%26+%3D+-%5BH_%7Bnew%7D+-+H_%7Bprior%7D%5D.++%5Cend%7Baligned%7D&bg=ffffff&fg=000&s=0&c=20201002)
This just means that the winning team’s increase in Elo ratings is always equal and opposite to the amount by which the losing team’s Elo rating drops. Elo ratings are zero-sum.
Since the ratings updates always add and subtract the same number of Elo points, points are never created or destroyed, as long as the number of teams stays constant. The ratings points are merely redistributed around the league as teams win and lose. This also means that if the league starts with an average team rating of 1500, the average always stays at 1500 (as long as the number of teams stays constant).
Notice also that the expression 

In contrast, for a very unequal match up, maybe p is 10%. Then,
The Constant K
We haven’t yet explained the mysterious constant K in the Elo update equations. This constant controls how much each game impacts the ratings. A large value of K means that ratings shift dramatically after each game, while a small value of K makes the ratings are relatively sticky. If K were zero, the Elo ratings would never move at all.
Setting the value of K in an Elo system is as much art as science. Elo systems for different sports usually different values for K. We will look at this important topic in more detail in an upcoming post. For now, we will use a value of 20 for K, which is the value FiveThirtyEight currently uses for the NBA. I made this choice for the time being to allow for easier comparison between FiveThiryEight’s more advanced Elo ratings and our simple ratings.
The Elo system essentially forgets the specifics of why the rating is what it is, since it lumps all the information into the one rating number. This makes Elo very fast and easy to implement. The main drawback is that Elo ratings can’t capture any insights from specific matches played in the past. An Elo system doesn’t remember that the Rockets beat the Warriors in 2 out of their 3 2017-18 regular season games, so it can’t use that match up information to make better predictions for the post-season if those two teams were to meet in the Western Conference Finals.
The Elo system also implicitly weights more recent matches more heavily than older matches. The value of K is directly related to this aspect of Elo ratings. This can be both a positive and a negative aspect of Elo systems, as we will explore in a future post. In chess, it’s reasonable to assume that less experienced players learn over time as they play, and this will show up in higher win percentages down the road. A rating system should try to capture this improvement. It’s much less clear how to think about this aspect in the context of professional sports, however.
How to Do This Yourself
You can find Python code to compute the simple NBA Elo ratings in this Jupyter notebook. This notebook includes code to scrape the NBA mach up data from stats.nba.com. It also shows you how to generate the plots included in this post.
If you take the time to go through the code, you’ll see that it really is a simple implementation of the ideas described in this post. In future posts, we’ll build on this framework to study and address some of the challenges and limitations of Elo ratings described in this post.
One important topic we didn’t study in this post is, how well do Elo ratings actually predict match up outcomes in the NBA? That will be the subject of our next post on Elo ratings. Stay tuned!